Russia’s invasion of Ukraine has served as a reminder of the importance of geopolitics for international economics. When Russia invaded Ukraine in February 2022 and sanctions were imposed, the rouble initially lost more than 60% of its value against the US dollar. It then recovered fully, however, giving rise to speculation about whether sanctions had their intended effect (Mukhin and Itskhoki 2022, Pestova et al. 2022, Sturm 2022).
Theoretical studies (Itskhoki and Mukhin 2022, Lorenzoni and Werning 2022) have provided frameworks for understanding the impact of sanctions. They stress that their effect on the exchange rate depends on the type of sanction imposed. Sanctioning exports and freezing official reserve assets reduce foreign currency supply, while sanctioning imports reduces foreign currency demand and force the sanctioned country to switch spending toward domestic goods, which leads to real appreciation of the currency.
These predictions match developments in the rouble exchange rate. But matching developments in a specific episode says nothing about the broader applicability of these models. In a recent paper (Eichengreen et al. 2023) we use the longer history of sanctions to test the predictions of the models and tease out the mechanisms.
We analyse an original database of sanctions spanning the period 1914-45, an era in which both large and small economies were targeted by multilateral sanctions. Episodes coded in the new dataset range from the blockade of the Central Powers during WWI to the invasion of Ethiopia by Fascist Italy and US freezing of foreign assets during WWII.
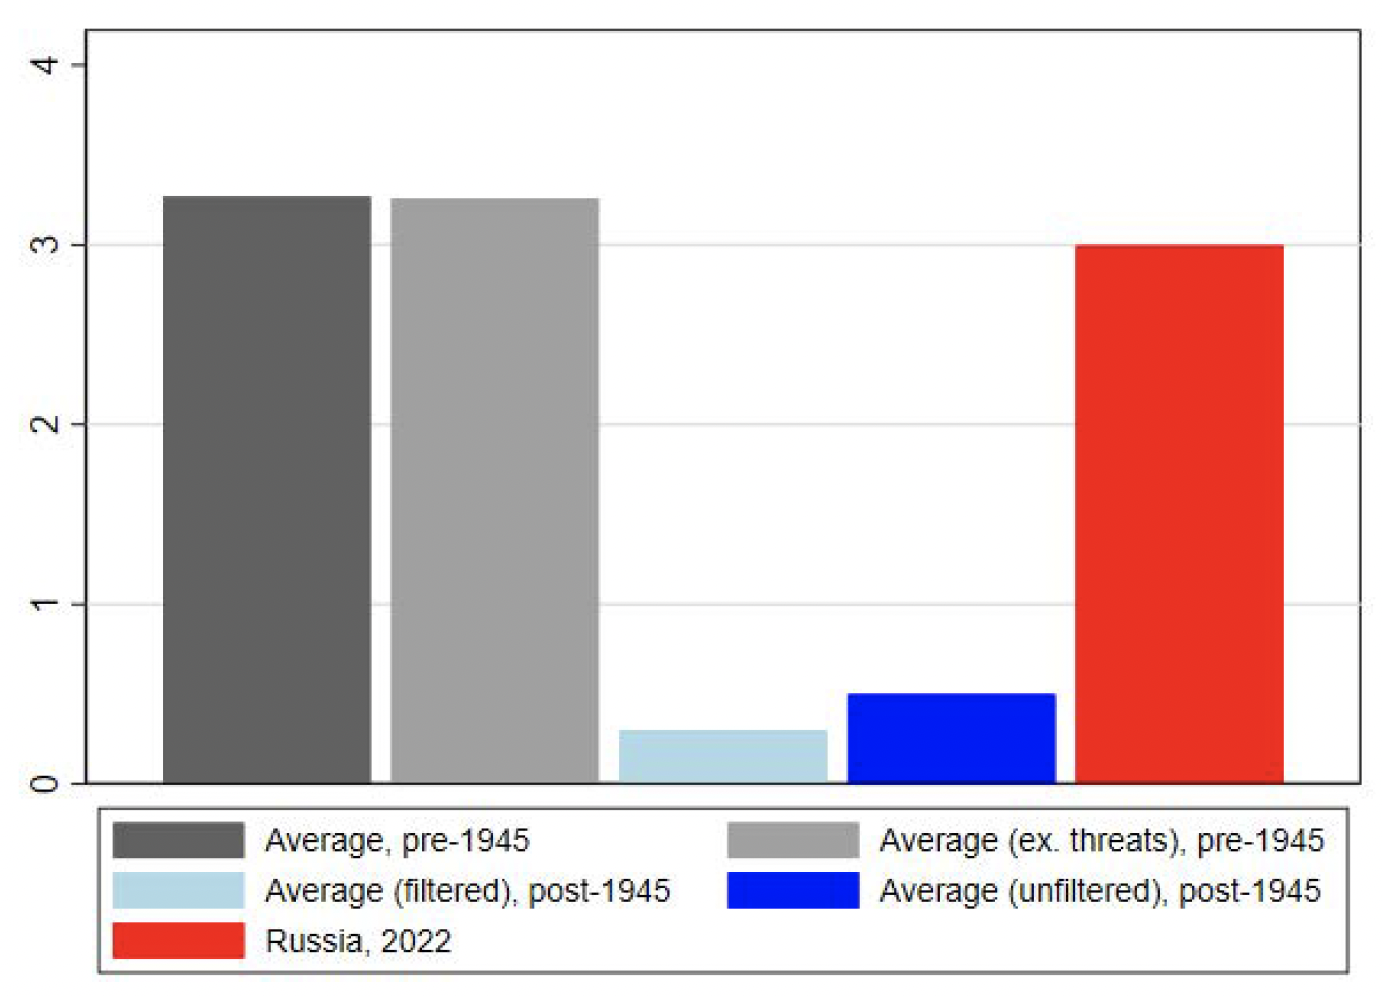
Figure 1 compares the scale of sanctions over the 1914-1945 period with those after WWII. It shows the average share of global GDP (in percentages) across sanctioned countries between 1914 and 1945 (grey bars), 1945 and 2018 (blue bars), and today’s Russia (red bar), respectively. As the figure shows, countries facing economic sanctions during WWI and the interwar period were of a size comparable to today’s Russia – about 2-3% of global GDP and trade. Countries facing economic sanctions after WWII were on average ten times smaller, accounting for about 0.2-0.3% of global GDP and trade.
Figure 1 Average share of global GDP across sanctioned countries in selected periods
Source: Eichengreen et al. (2023).
Note: The figure shows the average share of global GDP (in percentages) across sanctioned countries between 1914 and 1945 (grey bars), 1945 and 2018 (blue bars) and of today’s Russia (red bar), respectively. The dark blue bar corresponds to all cases. The light blue bar to cases restricted to those where (i) the objective of sanctions was to “end war”, “prevent war”, or “territorial conflict” and (ii) measures targeted arms and international trade or financial transactions—in the spirit of today’s sanctions on Russia.
Next, we obtain the dynamic response of the exchange rate using local projections, controlling for country fixed effects, time fixed effects and covariates. The dependent variable is the natural logarithm of 1 + the exchange rate of a given country i sampled at weekly frequency, defined as the number of currency i units per unit of US dollar. Estimated coefficients capture the dynamic response up to horizon k of the exchange rate of country i to the introduction of sanctions of type j in week t. The error term is robust to autocorrelation and heteroskedasticity.
We use data from Vicquéry (2022) for our dependent variable. Vicquéry (2022) digitised printed sources on the London foreign-exchange market in peacetime over two centuries. Weekly quotes for more than 40 currencies are available for the interwar period. In addition, we improve existing historical data for the period by digitising weekly quotes on the Swiss foreign-exchange market, which is better suited than London or New York to observe the black-market quotes in the 1930s and WWII. The resulting sample provides observations from January 1914 to September 1944 (when Swiss black foreign-exchange quotes stop being available). We winsorise the data at the 1% level to deal with potential outliers and measurement errors.
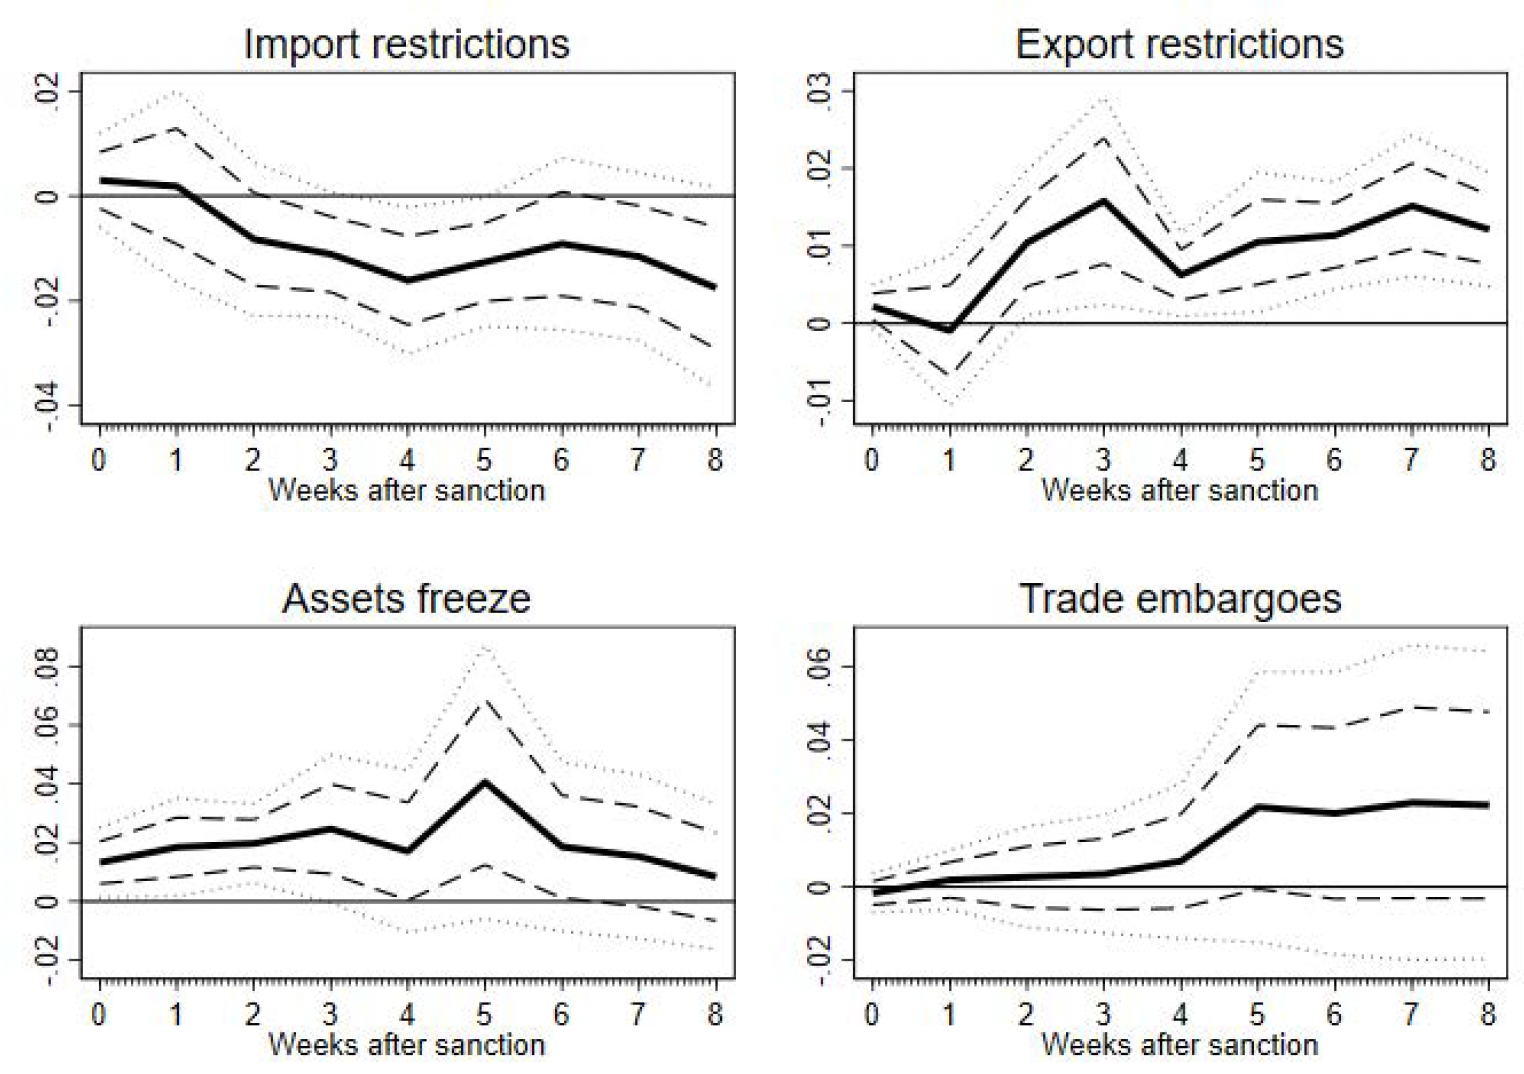
Figure 2 displays the estimated responses (shown as a solid black line) in weeks 0 to 8 to import restrictions (upper left panel), export restrictions (upper right panel), trade embargoes (lower right panel) and asset freezes (lower left panel). Positive values indicate depreciation against the dollar.
Figure 2 Dynamic estimates of the effects of economic sanctions on the exchange rate broken down by type
Source: Eichengreen et al. (2023).
Note: The figure shows baseline estimates of the responses of the exchange rate (shown as a solid black line) in weeks 0 to 8 following the introduction of import restrictions (upper left panel), export restrictions (upper right panel), trade embargoes (lower right panel) and asset freezes (lower left panel). Positive values indicate that the exchange rate depreciates vis-à-vis the US dollar. The local projection estimates are obtained by OLS over the full sample (1914-1945); they control for year fixed effects, week fixed effects, currency fixed effects and dummies for coincidental war outbreaks and endings. 1 (1.65) standard-deviation confidence bands are shown as dashed (dotted) lines.
The results confirm that effects on the exchange rate depend on type of sanction. Import restrictions are associated with exchange-rate appreciation and declining imports in line with model-based predictions. Restricting imports makes foreign currency more abundant and/or leads to a substitution from sanctioned imports to less desired varieties, where both mechanisms cause a stronger exchange rate.
The magnitude of the effect after one month is smaller than the movements we are observing in today’s rouble. But one reason why volatility in the rouble exchange rate was so large after Russia was hit by sanctions in 2022 is that the Central Bank of Russia (CRB) could no longer intervene in the foreign exchange market due to the freezing of Russia’s official foreign exchange reserves, though it could – and did – raise policy interest rates. Had the CBR intervened to lean against the effects of sanctions, in the manner of central banks of the earlier era – the response may have been more limited.
Export restrictions, on the other hand, are followed by exchange rate depreciation on the order of half a percent after one month. This is again consistent with model-based predictions that such measures reduce the supply of foreign currency and thereby weaken the exchange rate. Trade embargoes restricting both exports and imports do not impact the exchange rate significantly, consistent with the prior that the two types of sanctions offset. Asset freezes are associated with exchange rate depreciation proportional to the value of assets frozen, as posited by theory (asset freezes make foreign currency scarce and in turn weaken the exchange rate).
Our main results are robust when we control for geopolitical risk, financial openness, trade openness, trade tariffs, and time-varying country fixed effects; when we exclude sanctions imposed by the League of Nations and/or sanction threats from the estimation; when we restrict the estimates to countries neither on gold nor within currency blocs; and when we use alternative data on foreign exchange quotes.
These findings suggest that the effect of sanctions on the exchange rate depends on the balance of currency demand and supply, which can explain developments in the rouble exchange rate after Russia’s invasion. Russia’s currency recovered in mid-March 2022 from its initial depreciation at a time when tougher sanctions on imports than exports increased the supply of foreign currency—amid surging prices of oil and other commodities of which Russia is a major exporter—while the introduction of capital controls and financial repression by Russia reduced the demand for foreign currency. But the findings also suggest that recent models of the effects of sanctions on the exchange rate do not just match developments in today’s Russia episode but have broader applicability. They indicate that the direction of exchange rate movements is not an adequate metric of the success or failure of sanctions, but a reflection of the type and scale of measures imposed.
Authors’ note: The views expressed in this column are those of the authors and do not necessarily reflect those of the Bank of England or its committees, the European Central Bank or the Eurosystem.
References
Eichengreen, B, M Ferrari Minesso, A Mehl, I Vansteenkiste and R Vicquéry (2023), “Sanctions and the exchange rate in time”, paper presented at the 77th Economic Policy Panel Meeting on 20-21 April 2023, Riksbank, Stockholm.
Itskhoki, O and D Mukhin (2022), “Sanctions and the exchange rate”, NBER Working Paper No. 30009.
Mukhin, D and O Itskhoki (2022), “Sanctions and the exchange rate”, VoxEU.org, 16 May 2022.
Lorenzoni, G and I Werning (2022), “A minimalist model for the rouble during the Russian invasion of Ukraine”, NBER Working Paper No 29929.
Pestova, A, M Mamonov and S Ongena (2022), “The price of war: macroeconomic effects of the 2022 sanctions on Russia”, VoxEU.org, 15 April.
Sturm, J (2022), “The simple economics of a tariff on Russian energy imports”, VoxEU.org, 13 April.
Vicquéry, R (2022), “The rise and fall of global currencies over two centuries”, Working Paper 882, Banque de France.
