Sovereign emissions are seeing greater scrutiny from both investors and policymakers, but the challenge remains of how to systematically evaluate outcomes and allocate responsibility. There exists a continuum of intensity metrics and approaches to sovereign emissions accounting, including production-based (UNFCC 2008), consumption-based (Tukker et al. 2020, Cheng et al. 2022), extraction-based (Steiniger et al. 2016), income-based Liang et al. 2017), and value-added based (Pinero et al. 2018) metrics, or mixes of the above. While each of these metrics can provide useful insights into specific aspects of sovereign emissions, a common limitation that most of these approaches share is that they do not account holistically for structural differences between countries. For example, some countries are industrialised, others specialise in services; some are ageing, others are in the midst of a population boom; some are located in extreme climates, while others are located in temperate climates.
Sovereign emissions likely reflect many of these structural differences, which in turn can affect how countries rank against each other. The question then is how can investors and policymakers better understand the drivers of sovereign emissions and improve their risk management and engagement strategies?
Carbon emissions: A product of circumstance or environmental policy?
In a recent paper (Todorova et al. 2024), we introduce a conceptual framework of sovereign emissions that allows us to compare structural circumstances versus policy effort. Structural factors are drivers of emissions that countries are born with – i.e. geographic or socioeconomic parameters – which for the better part are unrelated to environmental policy. Hence, depending on their structural factors, the baseline or expected level of emissions could differ greatly by country. For some countries, circumstances have worked against them – for example, all else equal, countries that regularly experience very hot summers or very cold winters will have a higher demand for heating or cooling services, and hence higher emissions. For others, circumstances have helped them reduce emissions – for example, countries that have historically specialised in services or countries that have deindustrialised over time tend to have lower emissions.
Factors related to environmental and sustainability policy, on the other hand, include discretionary measures countries have taken to reduce their emissions, irrespective of or even despite their circumstances. For example, countries cannot change the natural climate and geography they are endowed with, but the mix between fossil fuels and clean energy that is used for heating and cooling is an outcome that can be influenced by policy. Further examples include R&D in sustainability technology and carbon taxes.
We argue that for a fairer and more holistic comparison across countries, we should evaluate countries based on their active effort to protect the environment, adjusting for circumstances that are outside of their control.
A systematic framework of sovereign emissions
We collected data on the carbon emissions for 21 countries over the period from 1990 to 2021. Our sample includes both developed and emerging market economies and covers over 70% of total global emissions. We normalise by GDP to account for differences in the size of the economy, and call this measure the carbon intensity of GDP.
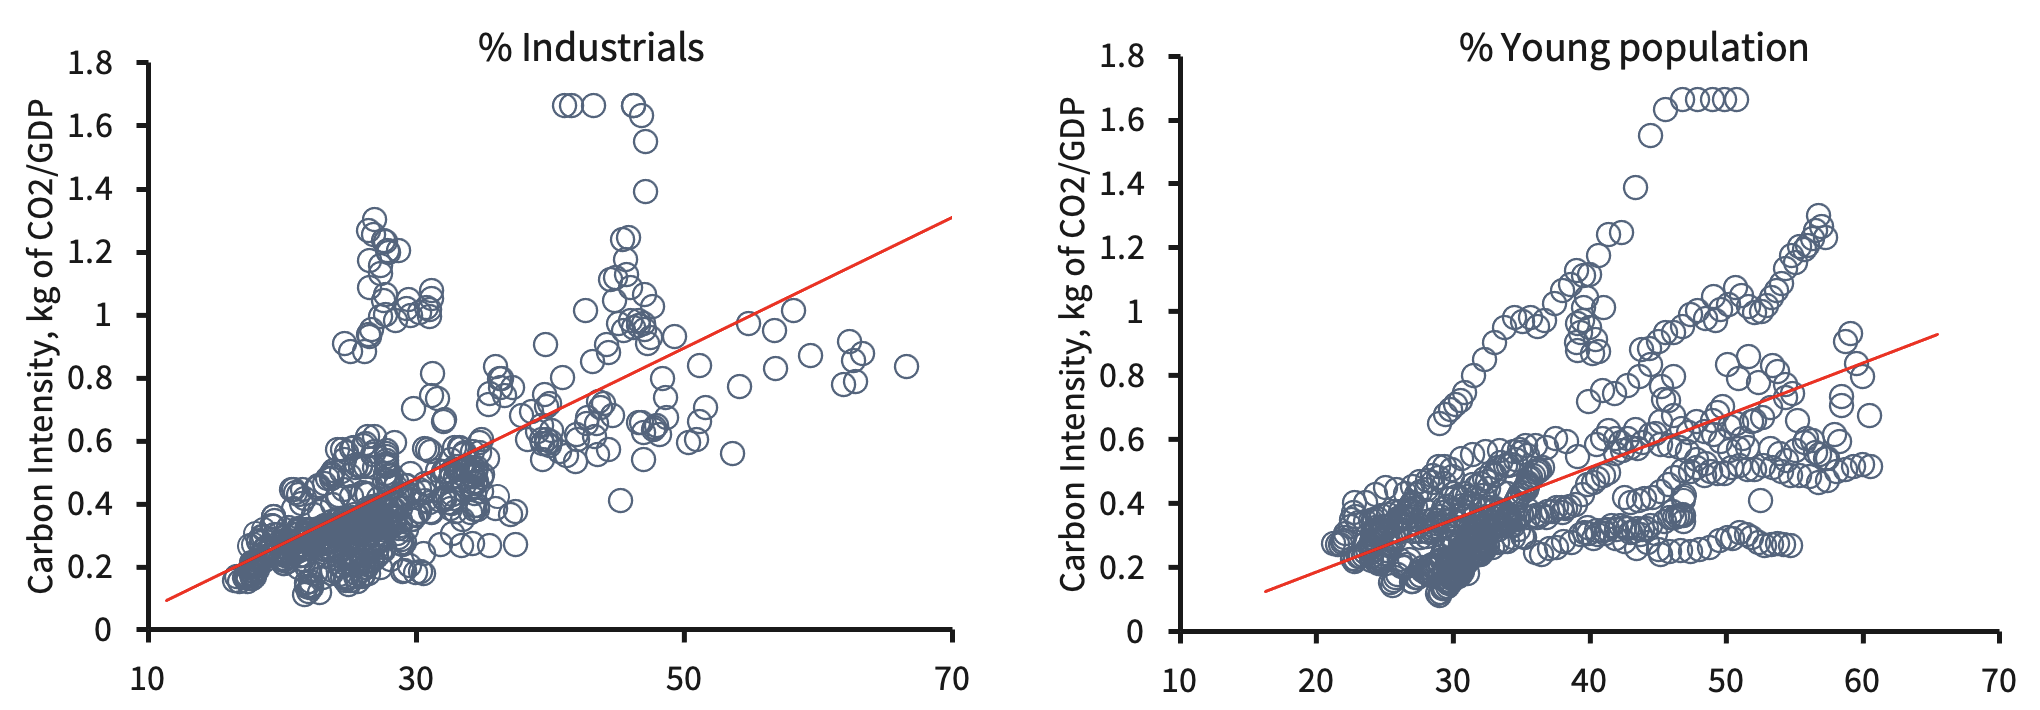
We analyse the impact of a wide range of structural variables related to the composition of the economy, international trade flows, demographics, geography, and natural climate. As an example, Figure 1 shows the correlation between carbon intensity and the share of industrials as a percentage of GDP (left panel) and the percentage of young population (right panel). We find that a higher industrialisation and a younger population correlate with higher carbon intensity.
Other factors that correlate with higher carbon intensity are a denser population, a higher share of agricultural land, and a more extreme climate. Using a more formal panel regression approach, we find that taken together, structural factors explain more than 50% of the differences in global sovereign emissions.
Figure 1 Sovereign emissions and structural factors
Notes: Percentage of industrials refers to the value added by the extractive industry, manufacturing, construction and utilities, expressed as a percentage of GDP. Percentage of the young population refers to the share of population under 25 years old.
Source: World Bank
A novel measure of green effort
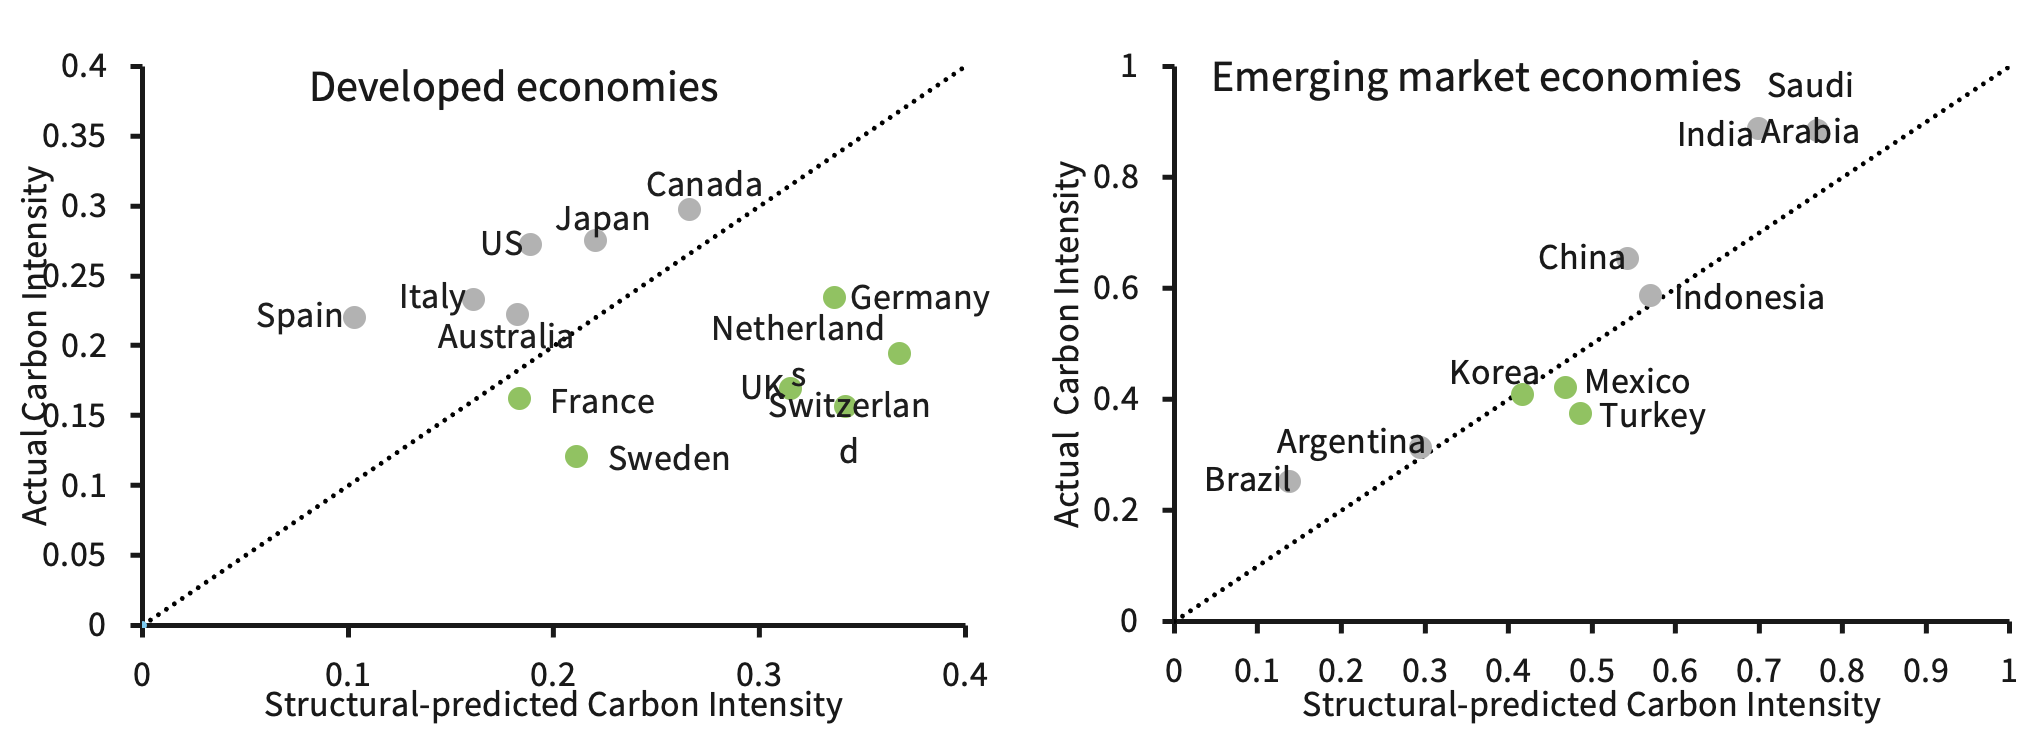
In Figure 2, we plot the model-predicted carbon intensity, i.e. the carbon intensity implied by a country’s structural factors (horizonal axis) against the actual carbon intensity (vertical axis), using data for 2021 as an example. By comparing the predicted and the actual values, we arrive at a new measure of carbon intensity which is independent of history and circumstances, and which we believe better captures efforts by policymakers to protect the environment. Countries below the 45-degree line of equal fit have lower-than-predicted carbon intensity (green countries) and countries above the line have higher-than-predicted carbon intensity (grey countries).
Figure 2 The green residual
Source: Barclays Research, World Bank, Global Carbon Project
Using this new measure, we find that as of 2021, developed countries such as the US, Japan, and Canada appear as countries with low levels of green effort, whereas countries such as Germany, the UK, and Switzerland appear as countries with high levels of green effort. In the emerging markets group, Korea and Mexico are examples of countries that rank higher on green effort, whereas China, India and Brazil rank lower.
Policy implications
The fact that the structural component explains more than 50% of the cross-country differences in emissions illustrates why it could be hard to detect progress towards protecting the environment. There might be a significant delay between the implementation of green policies and the visibility of their results. In the meantime, the structural component might still completely overwhelm the green component, making it harder to detect progress.
Further, our framework could help policymakers and investors to better understand the drivers of sovereign emissions and attribute any changes to the correct sources – i.e. a change in circumstances or a change in policy effort. For example, since 1990, most developed countries in our sample have decreased their carbon intensity by between 20% and 30%. However, we attribute between 10% and 15% of this decrease to the coincidental declining contribution of industrial production to GDP and a transition towards a more services-based economy.
This suggests that circumstances have so far helped developed countries reduce their carbon footprint. However, as these economies face headwinds on the back of supply chain disruptions, slowing globalisation after the COVID-19 pandemic, and geopolitical uncertainty related to international trade flows, the share of industrial activity is expected to rise. This suggests that as circumstances move against them, developed countries might have to focus more on sustainability policy to meet their carbon emission reduction targets.
Discussion
The key insight of our study is that analysing sovereign emissions closely resembles the nature versus nurture debate – a more holistic evaluation requires that we consider the effect of both circumstances and policy decisions. Structural differences significantly complicate the debate and introduce important nuances. For example, Andreou et al. (2024) show that the effectiveness of market-based initiatives such as the EU Emissions Trading System critically depends on national structural characteristics such as the presence of skilled labour and technological infrastructure.
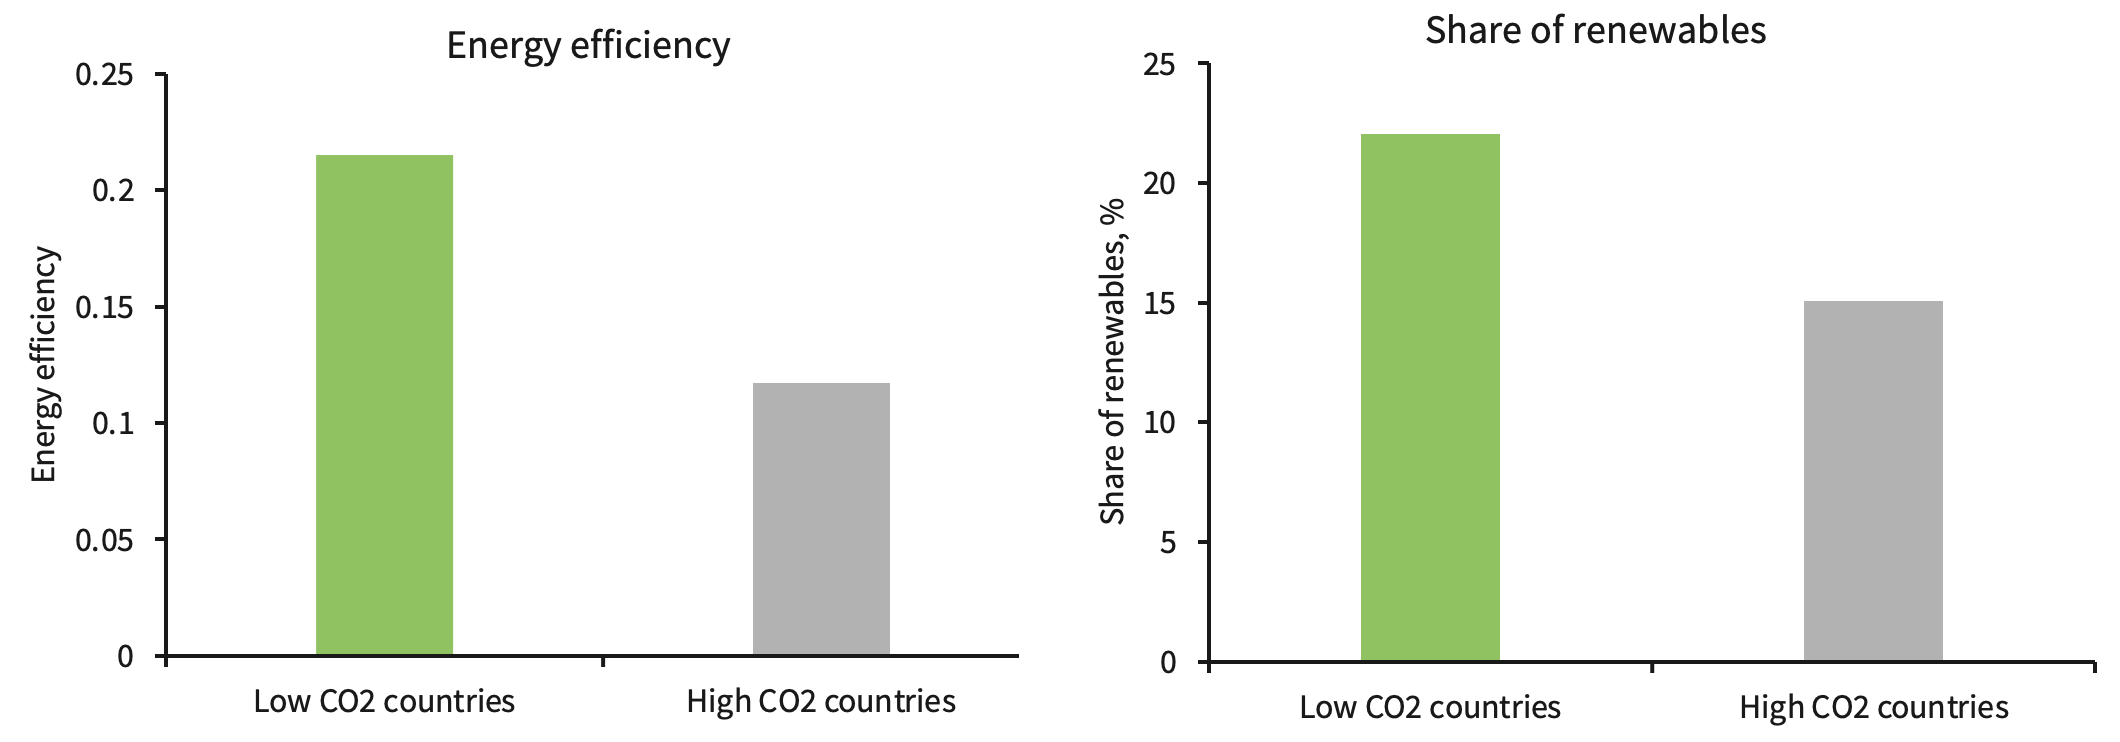
Our framework helps to illustrate the difficult challenge that policymakers will continue to face in the future: economic growth and sustainability are influenced by similar factors, but often in opposing ways. In our model, younger demographics correlate with worse emissions outcomes, but economic theory predicts that population growth increases the labour supply, which then translates into higher economic growth. However, recent research shows that for many developed countries, the historically positive relationship between carbon intensity and economic growth has weakened recently (Loungani 2018). According to our analysis this decoupling has occurred through two channels: investments in renewables and advances in energy efficiency (Figure 3).
Figure 3 Decoupling economic growth and emissions through investments in renewables and energy efficiency
Notes: Energy efficiency is measured as the amount of GDP produced by one unit of energy. All bars show 2017-2019 averages for high growth countries. High growth countries are defined as those countries whose cumulative growth over the last 10 years was above the sample median.
Source: World Bank, IEA
The challenge remains that financing clean energy projects often requires high upfront spending (Dees and Seghini 2024). This might be particularly challenging in macroeconomic environments of high interest rates or for developing countries, which typically face higher cost of capital and have weaker capital markets.
Achieving net zero will require policy interventions, drastic shifts in behaviour, and above all a great degree of international cooperation to ensure that the strategies are realistic and fair.
Authors’ note: The views expressed in this column reflect the opinions of the authors and do not necessarily express the views of Barclays.
References
Andreou, P, S Anyfantaki, C Cabolis, and K Dellis (2024), “Unravelling the drivers of emissions reduction: A deep dive into national characteristics”, VoxEU.org, 12 March
Cheng, H, J Ishikawa, and P Airebule (2022), “Shared responsibility criterion for allocating carbon emissions across countries”, VoxEU.org, 28 February.
Dees, S and C Seghini (2024), “The green transition and public finances: Balancing climate mitigation and fiscal sustainability”, VoxEU.org, 5 August
IEA (2023), World Energy Investment 2023.
Liang, S, S Qu, Z Zhu, D Guan, and M Xu (2017), “Income-based greenhouse gas emissions of nations”, Environmental Science & Technology (51): 346-355
Loungani, P (2018), “Decoupling of emissions and incomes: It’s happening”, VoxEU.org, 23 October
Pinero, P, M Bruckner, H Wieland, E Pongracz, and S Giljum (2018), “The raw material basis of global value chains: Allocating environmental responsibility based on value generation”, Economic Systems Research 31(2): 206-227
Steininger, K, C Lininger, L. Meyer, P Munoz and T Schinko (2016), “Multiple carbon accounting to support just and effective climate policies”, Nature Climate Change (6): 35–41
Todorova, Z, C Garcia, M O’Neil, C Edwards, J Isvy and C Keller (2024), “Sovereign emissions: nature vs nurture”, Barclays Research, 22 May
Tukker, A, H Pollitt, and M Henkermans (2020), “Consumption-based carbon accounting: sense and sensibility”, Climate Policy 20(S1): 1-13
UNFCCC (2008), “Kyoto protocol reference manual on accounting of emissions and assigned amount”, Geneva, Switzerland: United Nations Framework Convention on Climate Change.


